Sustainability
We have an important role to play in creating a more sustainable and inclusive future.

We have an important role to play in creating a more sustainable and inclusive future.

Our report provides an update on how we are Helping Britain Prosper in a way that delivers long-term profit and returns.

We put you first, so you can put our customers first.
Our report provides an update on how we are Helping Britain Prosper in a way that delivers long-term profit and returns.

Disclosures relating to our strategic, financial, operational, environmental and social performance.

See all the key dates in the financial year.

Higher, more sustainable returns as we continue to Help Britain Prosper.

With hubs across the UK, there's a place for you.

We're searching for the best talent to join us in Leeds.

Join us as we explore new ideas and technologies to reshape the world of finance.
We have an important role to play in creating a more sustainable and inclusive future.
Our report provides an update on how we are Helping Britain Prosper in a way that delivers long-term profit and returns.
We put you first, so you can put our customers first.
Our report provides an update on how we are Helping Britain Prosper in a way that delivers long-term profit and returns.
Disclosures relating to our strategic, financial, operational, environmental and social performance.
See all the key dates in the financial year.
Higher, more sustainable returns as we continue to Help Britain Prosper.
With hubs across the UK, there's a place for you.
We're searching for the best talent to join us in Leeds.
Join us as we explore new ideas and technologies to reshape the world of finance.

Last year marked 20 years of the Scottish Widows Women and Retirement Report, in which we said it would take at least another two decades before the gender pension gap was closed.
In this year’s report we’ve actually seen that gap widen further from 30% to 32%, resulting in women on track to retire with an average retirement income of £13,000, compared to £19,000 for men.
Here we use our National Retirement Forecast to show the gender gap in the retirement outcomes people are on track for.
The NRF compares the retirement income people are on track for based on their current saving behaviour to the costs they could face: living expenses for different retirement living standards defined by Pensions UK, and housing costs for those who expect to rent or continue to pay off a mortgage in retirement.
Women are projected to achieve a median annual retirement income after expected housing costs that is 32% lower than men’s (£13k for women vs £19k for men). As a result, fewer women are expected to achieve a moderate or comfortable retirement (32% vs 45%).
However, many women are already building strong retirement foundations and reducing this gap, so more women achieving comfortable rather than minimum standards in retirement is within reach with earlier investing, targeted guidance and confident planning.
The NRF, first run in our 2023 Retirement Report with Frontier Economics, projects retirement outcomes for those aged 22 to 65 based on savings, behaviours, and income sources, comparing expected income to potential living and housing costs in retirement.
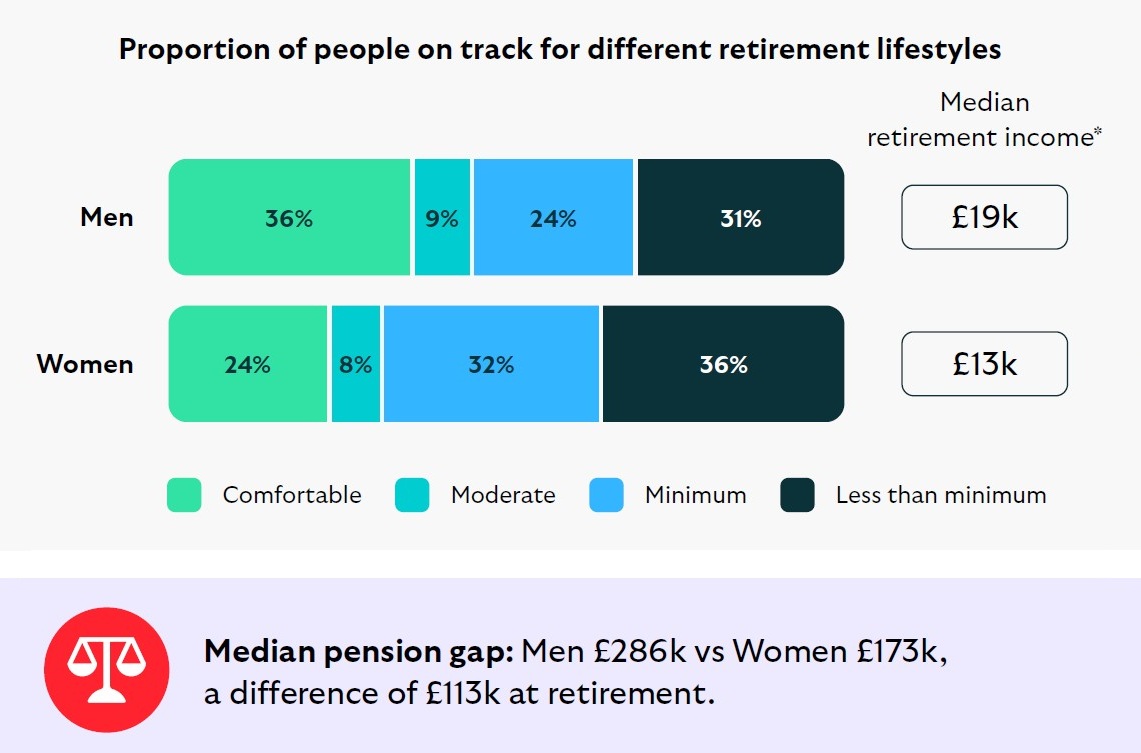
*Median retirement income after paying for expected housing expenses if relevant.
Source: Frontier Economics modelling based on Scottish Widows’ annual Retirement Report survey, and using Pensions UK’s Retirement Lifestyle Standards.
Note: This chart uses the 2025 Pensions UK’s Retirement Living Standards, which were updated after the May 2025 Retirement Report. The revised thresholds, reflecting recent falls in energy costs and related factors, mean more people are projected to achieve at least a minimum retirement standard. As Pensions UK’s thresholds are periodically revised, comparisons with earlier reports should be treated with caution.
Pensions UK’s standards show the income thresholds for different retirement lifestyles, in terms of the amount that can be spent on food, clothing, transportation, holidays, and maintenance of a home.
This year the standards switch from “single/couple” to “one person/two person” households, reflecting that retirees may share housing and costs without being partners.
Pensions UK’s retirement living standards have fallen for minimum retirees due to lower energy prices and a shift in public expectations of what constitutes acceptable standards in retirement. Meanwhile, moderate and comfortable standards have edged up, driven by inflation in other areas, though those increases are partially offset by the same lower energy costs.

Note: The costs shown in this table are for one person and two person households living outside of London. The forecast also considers standards for those who live in London. *% increase to the 2025 Pensions UK standards based on 2024 data, compared to previous Pensions UK standards based on 2023 data. Source: Pensions UK thresholds.
In this section we explore how career breaks affect women’s earnings, savings and retirement outlook, and how differences in planning and support make these breaks a greater financial struggle for women.
Career breaks are a major driver of differences in women’s financial resilience compared with men, and arguably the single biggest driver of the gender pension gap. Around half of all women have taken a career break compared with only one in five men, and around one quarter of women over 55 have spent five years or more out of the workforce.
Childcare, in addition to maternity leave, is the standout reason for career breaks, but health and other factors also play a role. Women experiencing menopause or peri-menopause (the transitional phase leading up to menopause) report slightly higher financial strain and are more likely to say they need to work for longer as a result of their career break.

And a quarter over 55 have taken breaks totalling five or more years.
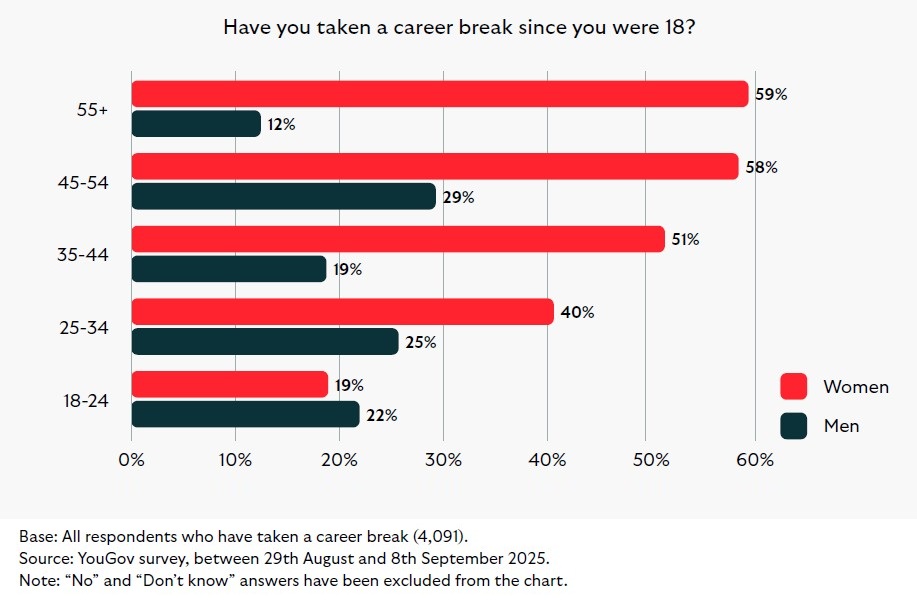
50% of women have taken a break vs 20% of men.
The gap is largest for those 55+, where nearly 60% of women have taken a break whereas only around 10% of men have done so.
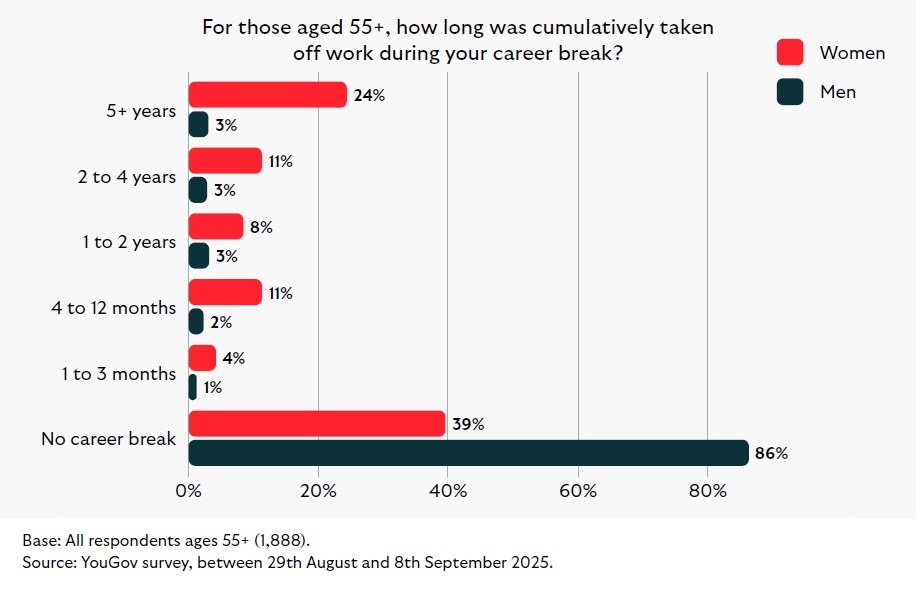
This compares to just 3% of men.
When reaching retirement, many women have effectively lost multiple working years, with knock-on effects for earnings and pensions.
But they are less likely to plan financially for them.
61% of women said they managed their money well during a career break, vs 58% of men.
40% of women did not plan financially in preparation for their career break (vs 30% for men).
55% of women found the loss of earnings a financial struggle (vs 47% for men).
And those in menopause report being more likely to need to work longer.
36% of women take a career break to care for children, in addition to maternity leave, whereas this proportion is 3% for men. A recent ONS study revealed a clear motherhood penalty, mothers lose around £65,600 in earnings by their first child’s fifth birthday, with the biggest drop in income seen during the first year after birth*.
The next top 3 reasons women take career breaks are:
*Source: The impact of motherhood on monthly employee earnings and employment status, England – Office for National Statistics.
Women aged 45-54 who take career breaks and currently report menopause or peri-menopause may face a slightly greater financial strain and are more likely to work longer than women who are not currently facing menopause.
For those women aged 45-54 who take career breaks and currently report menopause or peri-menopause we find:
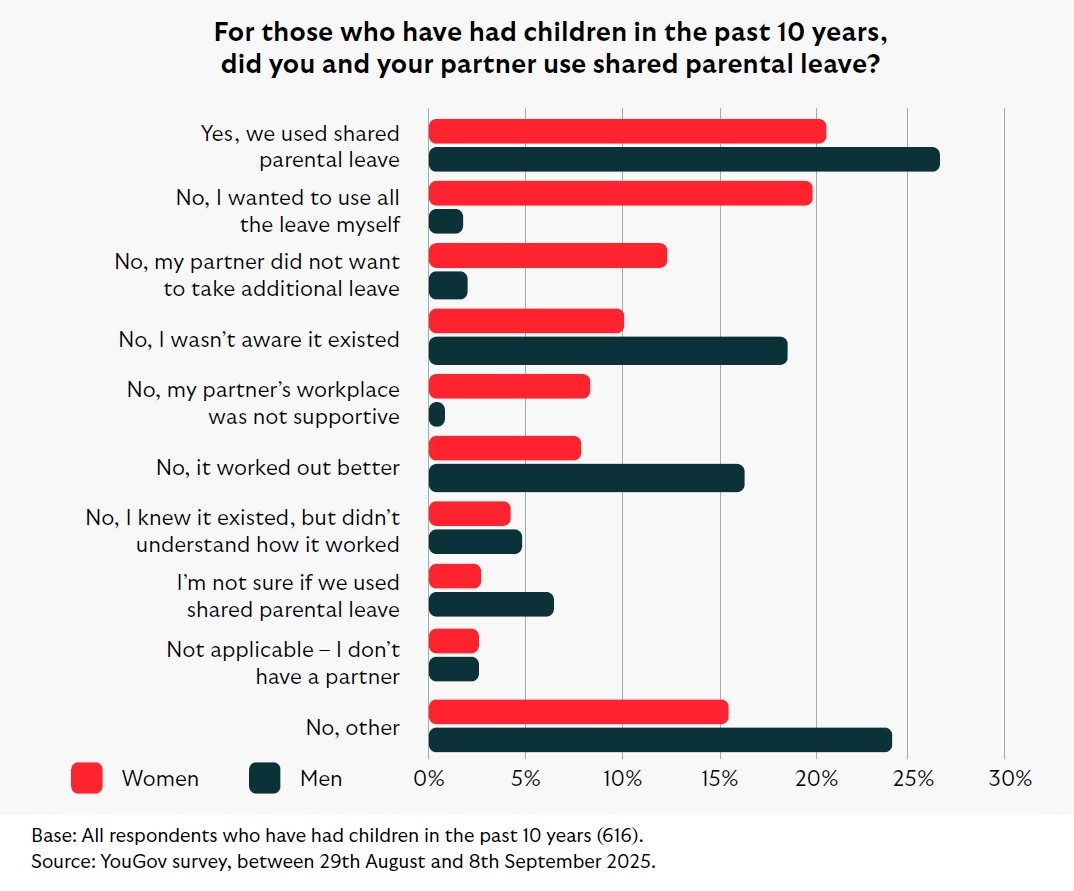
One in five women and around one in four men say they used SPL. This difference in reported usage may reflect that some men believe they are using SPL, while they may just be making use of paternity leave – offered on a statutory basis or by their employer.
In this section, we explore these patterns in financial resilience, looking at how women’s savings expectations compare with actual buffers, and how employment type affects saving behaviours.
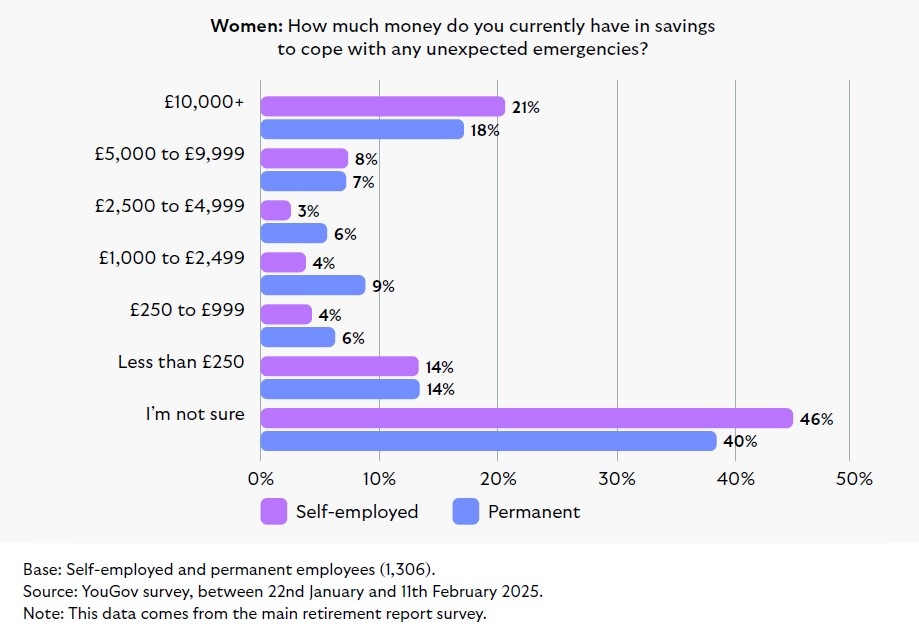
Women are more likely than men to prioritise saving for emergencies, and more likely to believe they need at least £1,000 put aside for rainy-day savings. However, fewer women report having £10,000 or more saved compared with men, highlighting a resilience gap at higher savings levels.
Differences are also visible between self-employed and permanent workers. Self-employed women are more likely to say they are saving for a rainy day, and more likely to report having £10,000+ in emergency savings.
And they want to build a savings buffer, but have fewer savings than men.
44% of women prioritise saving for emergencies or a rainy day, in comparison to 39% of men.
71% of women and 59% of men believe they need at least £1,000 for rainy days.
24% of men have savings above £10,000 compared to only 16% of women.

And they're more likely to report higher savings despite having lower income on average.
53% of self-employed women said they're currently working towards savings for emergencies or a rainy day, compared to 48% of permanent employees.
That’s despite them having a lower average gross income of £21,000 compared to £32,600 for women in permanent roles.
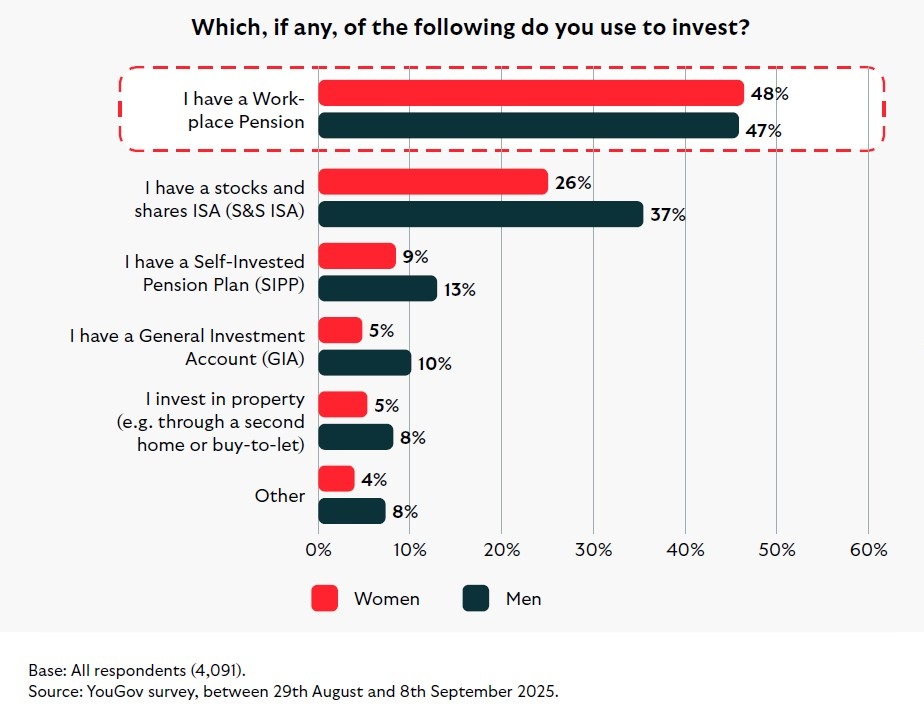
Women are just as likely to invest via a workplace pension. However, they are less likely than men to invest outside of pensions, often preferring to build up a savings buffer before committing to investments.
Many women also say they do not see investing as “for them” or that they would not invest regardless of the amount of savings they had, even though large numbers are already investors through workplace pensions.
In this section, we explore these patterns and highlight the importance of broadening women’s confidence and access to a wider set of investment opportunities.

And there's a feeling among many women that investment is not for them.
That's even if they are already investing in a workplace pension.
Though a minority say they would never want to invest.
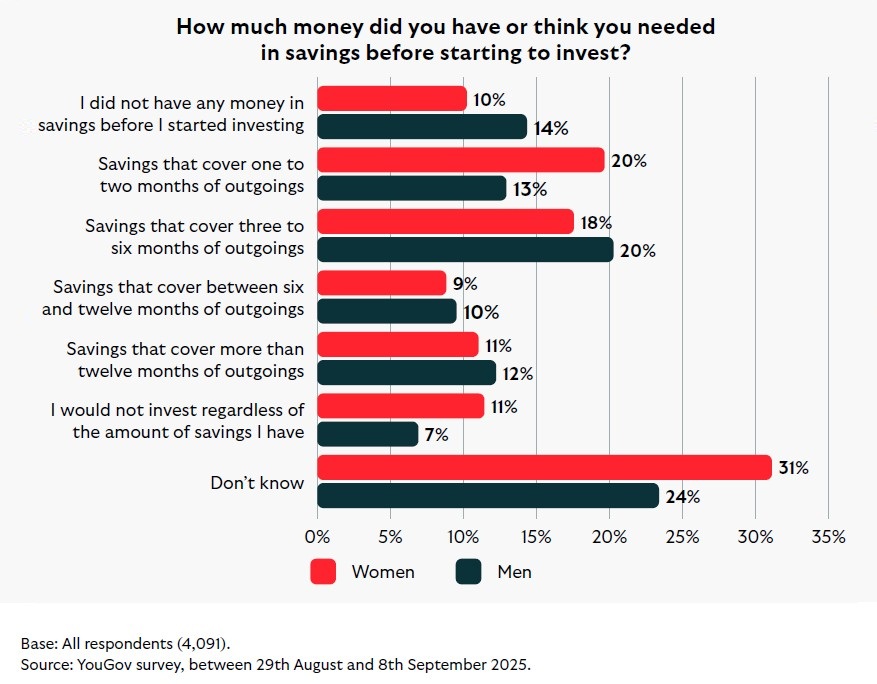
They often ensure they have some savings in place first.
Women are slightly less likely to use digital planning tools to support their financial decisions but clearer guidance and trusted delivery would encourage greater use.
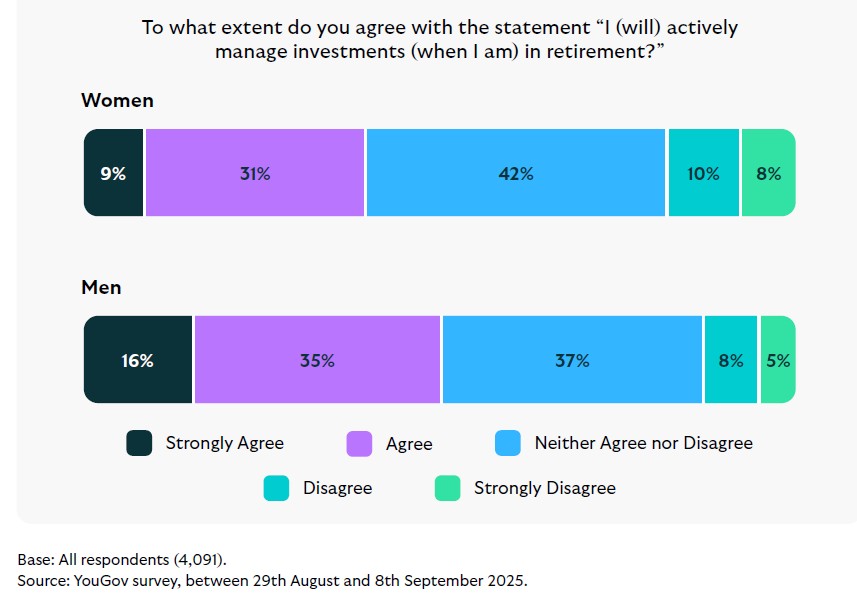
Women are less likely than men to actively manage their investments in retirement, even though they are just as likely to seek professional advice when making financial decisions. This suggests that while women may be less hands-on in managing their portfolios, they are equally willing to engage with financial support.
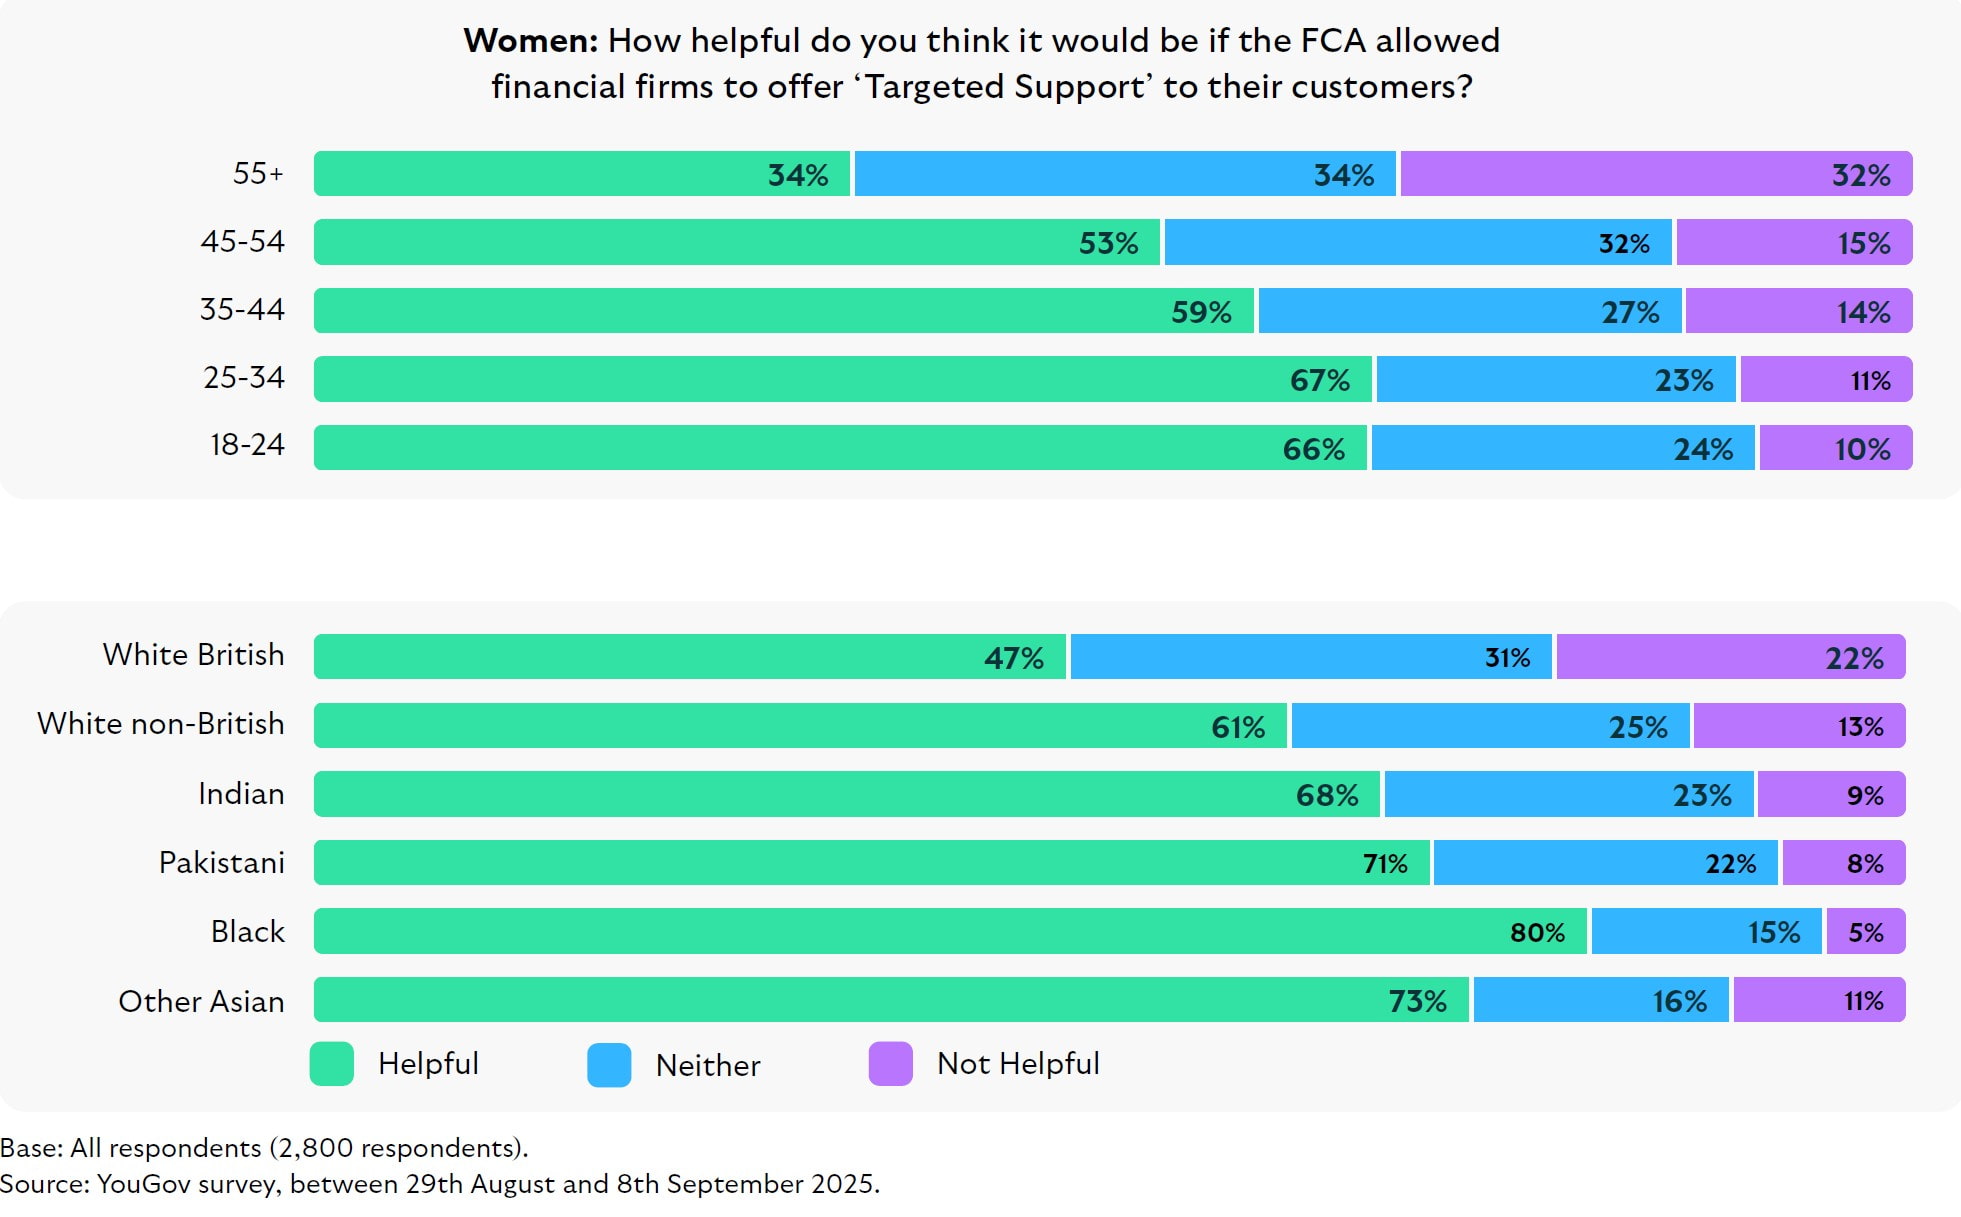
At the same time, younger women in particular see value in the FCA’s proposed ‘targeted support’, highlighting the potential for new forms of guidance to bridge gaps in financial planning.
In this section we explore these patterns and argue that there is a real opportunity to empower women with timely, accessible support that helps them plan and invest more confidently for later life.
But they're less likely to use financial planning tools.
The same proportion (81%) of women and men say they actively plan their finances, for example setting budgets, tracking bills and planning for retirement.
When it comes to using digital planning tools (e.g., apps, bank portals, online calculators), women report lower usage than men.
For long-term goals such as savings and pensions, 15% of women vs 21% of men use digital tools; for short-term budgeting/day-to-day planning, the figures are 14% vs 19%.
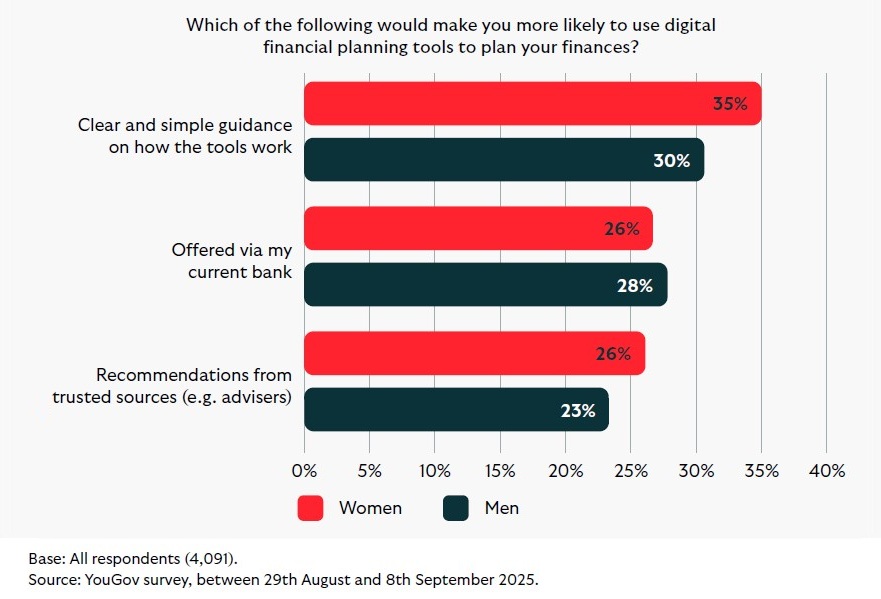
Trusted sources and bank delivery are also important.
But they show a similar appetite for financial advice.
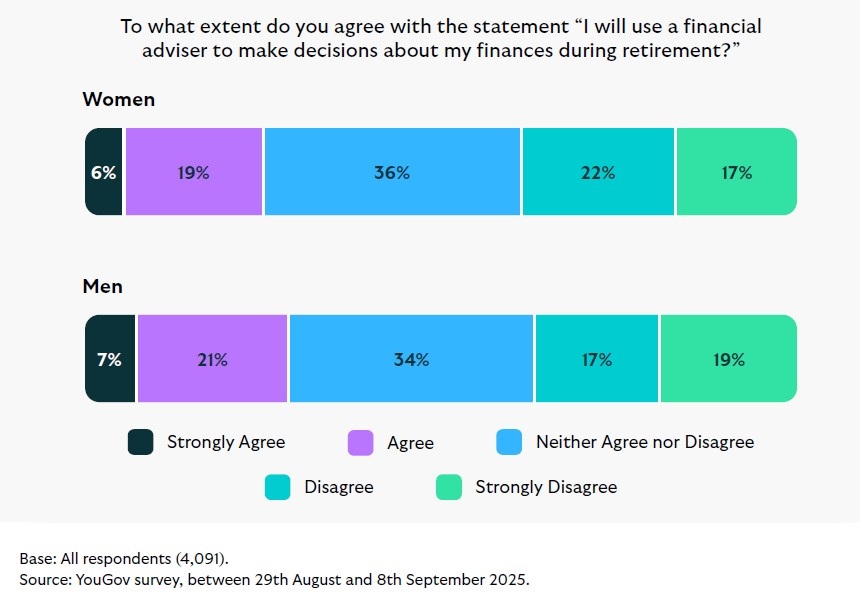
This shows equal willingness to seek professional support.
Especially younger women and women from ethnic minority groups.
*Source: ONS (2025): Household total wealth in Great Britain: April 2020 to March 2022.

**See equity release methodology section (page 33) for more detail.
***Median private pension pot size for those with a private pension. This does not include other savings available at retirement.
Beyond the pensions system there needs to be adequate provision of childcare to allow women to fulfil their ambitions in the workplace, and not only in those wealthier local authorities which have the necessary resources. There also needs to be continued action in closing the gender pay gap.
Pete Glancy, Head of Policy, Pensions and Investments

Head of Workplace Strategic Relationships

Chief Customer & Digital Officer, Scottish Widows

Business Development Director

Head of Policy, Pensions and Investments

Engagement Consultant

Scottish Widows Design Lead
The gender pension gap is the difference between the typical retirement income of women and men, reflecting factors such as career breaks, caring responsibilities, pay inequality, and differences in investing patterns. Read more about the causes behind the gender pension gap.
Currently, there is a 32% gap in median annual retirement income, with women on track to receive £13,000 per year compared to £19,000 for men, which is a difference of £113,000 in median pension wealth at retirement.
We’re calling on the government to help by promoting affordable childcare, reforming auto-enrolment to include part-time and multiple job holders, improving the visibility of joint life annuities, ensuring pension pots are considered in divorce settlements, introducing targeted financial support, and integrating housing equity into retirement planning. Read more about the Scottish Widows policy asks.
Career breaks, especially for childcare, are one of the biggest driver of the gender pension gap; half of women take career breaks compared to one in five men, leading to lost earnings and pension contributions that significantly reduce women’s retirement savings.
Maternity leave often results in women pausing or reducing pension contributions, with mothers losing around £65,000 in earnings by their first child’s fifth birthday, which has a lasting negative impact on their retirement savings.
Women are often left with the family home after divorce, and releasing housing equity (on average around £100,000) can help bridge the pension gap; it’s important that pension pots are included in divorce discussions to ensure fair outcomes.
Women are just as likely as men to invest via workplace pensions but are less likely to invest outside pensions, often preferring to build up savings first and being less likely to see themselves as investors.
Barriers include a lack of confidence, perception that investing is not for them, a preference for building savings before investing, confusion about how much to save before investing, and the portrayal of investing as complex and male dominated.
18 Nov 2025 | Jill Henderson
Women face a 32% gender pension gap driven by career breaks, childcare responsibilities and lower investment confidence, but with practical steps and policy support this gap can be closed.
Our approach to financial wellbeing is about offering support, tools and guidance that helps customers to make informed decisions – whether that’s learning how to budget, save, or bank online.
Read about what we're doing to financially empower our customers, get the latest insights from our experts and explore some of the products we offer.