Sustainability
We have an important role to play in creating a more sustainable and inclusive future.

We have an important role to play in creating a more sustainable and inclusive future.

Our report provides an update on how we are Helping Britain Prosper in a way that delivers long-term profit and returns.

We put you first, so you can put our customers first.
Our report provides an update on how we are Helping Britain Prosper in a way that delivers long-term profit and returns.

Disclosures relating to our strategic, financial, operational, environmental and social performance.

See all the key dates in the financial year.

Higher, more sustainable returns as we continue to Help Britain Prosper.

We've ranked in the top 10 employers for both graduates and apprenticeships in The Times Top 100.

We're searching for the best talent to join us in Leeds.

Join us as we explore new ideas and technologies to reshape the world of finance.
We have an important role to play in creating a more sustainable and inclusive future.
Our report provides an update on how we are Helping Britain Prosper in a way that delivers long-term profit and returns.
We put you first, so you can put our customers first.
Our report provides an update on how we are Helping Britain Prosper in a way that delivers long-term profit and returns.
Disclosures relating to our strategic, financial, operational, environmental and social performance.
See all the key dates in the financial year.
Higher, more sustainable returns as we continue to Help Britain Prosper.
We've ranked in the top 10 employers for both graduates and apprenticeships in The Times Top 100.
We're searching for the best talent to join us in Leeds.
Join us as we explore new ideas and technologies to reshape the world of finance.
Higher, more sustainable returns as we continue Helping Britain Prosper.
Lloyds Banking Group is the UK's largest digital bank.
We have a number of distinct competitive strengths that collectively differentiate our proposition.
Read our annual report to find out more about our business model.
Building on our strong foundations and distinct competitive strengths, our purpose of Helping Britain Prosper forms the basis of our strategy to profitably deliver for all of our stakeholders.
UK customer-focused digital leader and integrated financial services provider, capitalising on new opportunities, at scale.
Drive revenue growth and diversification.
Strengthen cost and capital efficiency.
Maximise the potential of people, technology and data.
Higher, more sustainable, returns and capital generation

Our new strategy, Accelerate 2030, builds on the foundations created over 2022 to 2026. The strategy aligns with our purpose of Helping Britain Prosper and our customer promise of ‘making finance simpler, smarter and more connected for every moment that matters’.
The ambitious strategy accelerates our transformation through reimagined customer experiences, increased Group connectivity, and a productivity step change, all enabled by pioneering technology.
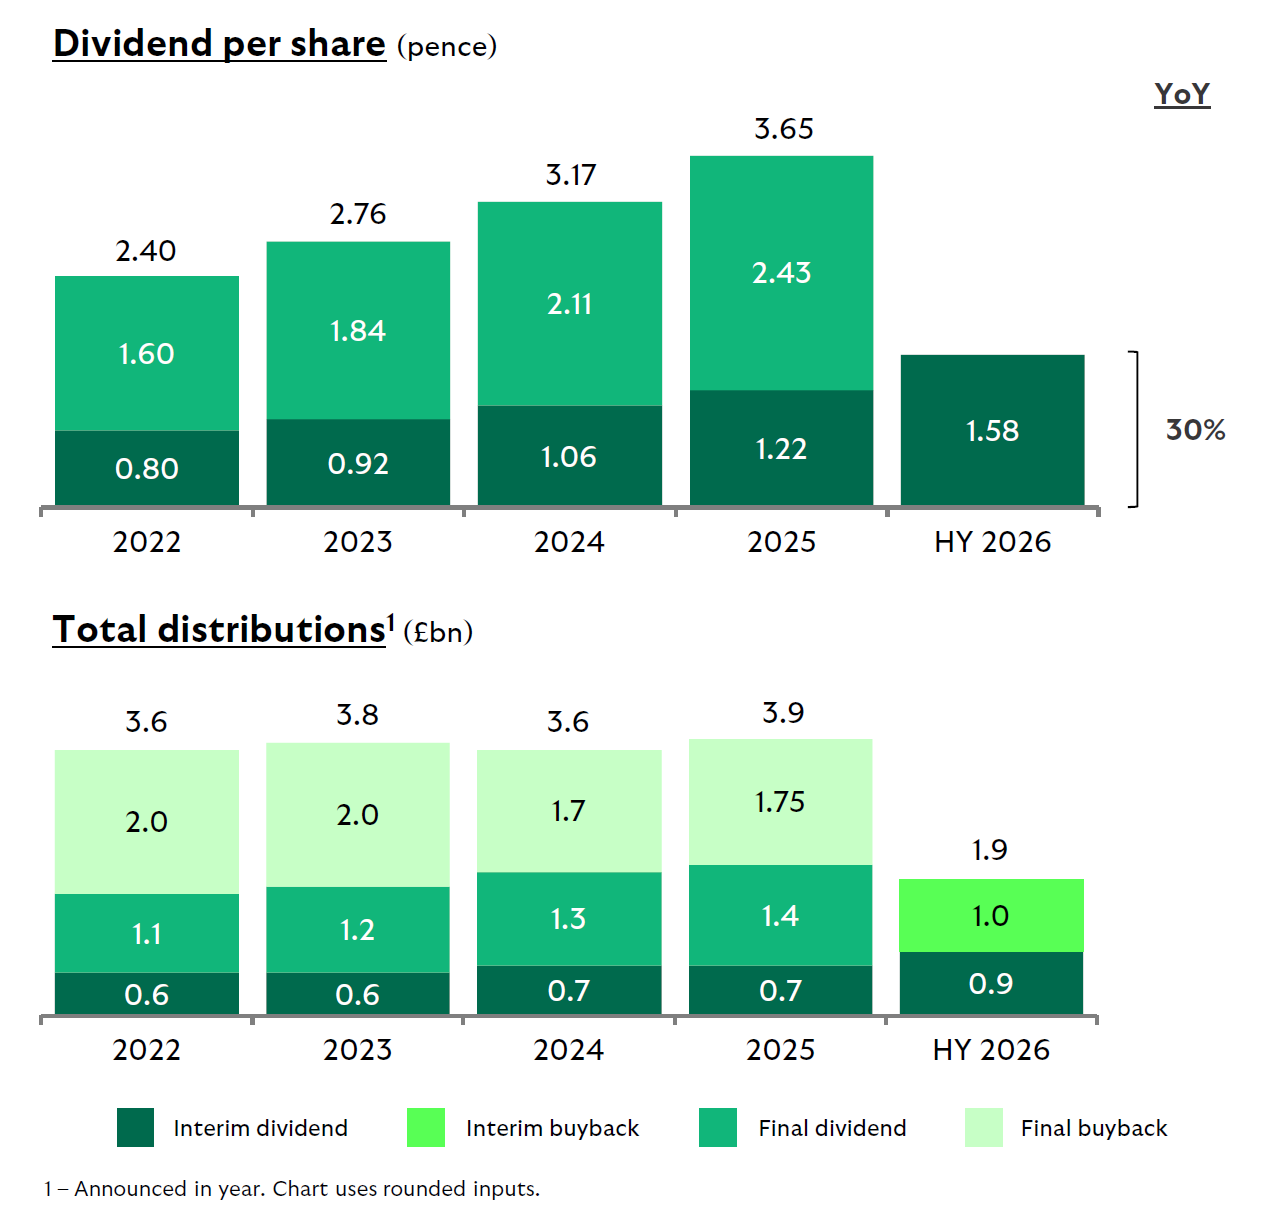
The Group has a progressive and sustainable ordinary dividend policy whilst maintaining the flexibility to return further surplus capital through buybacks or special dividends.
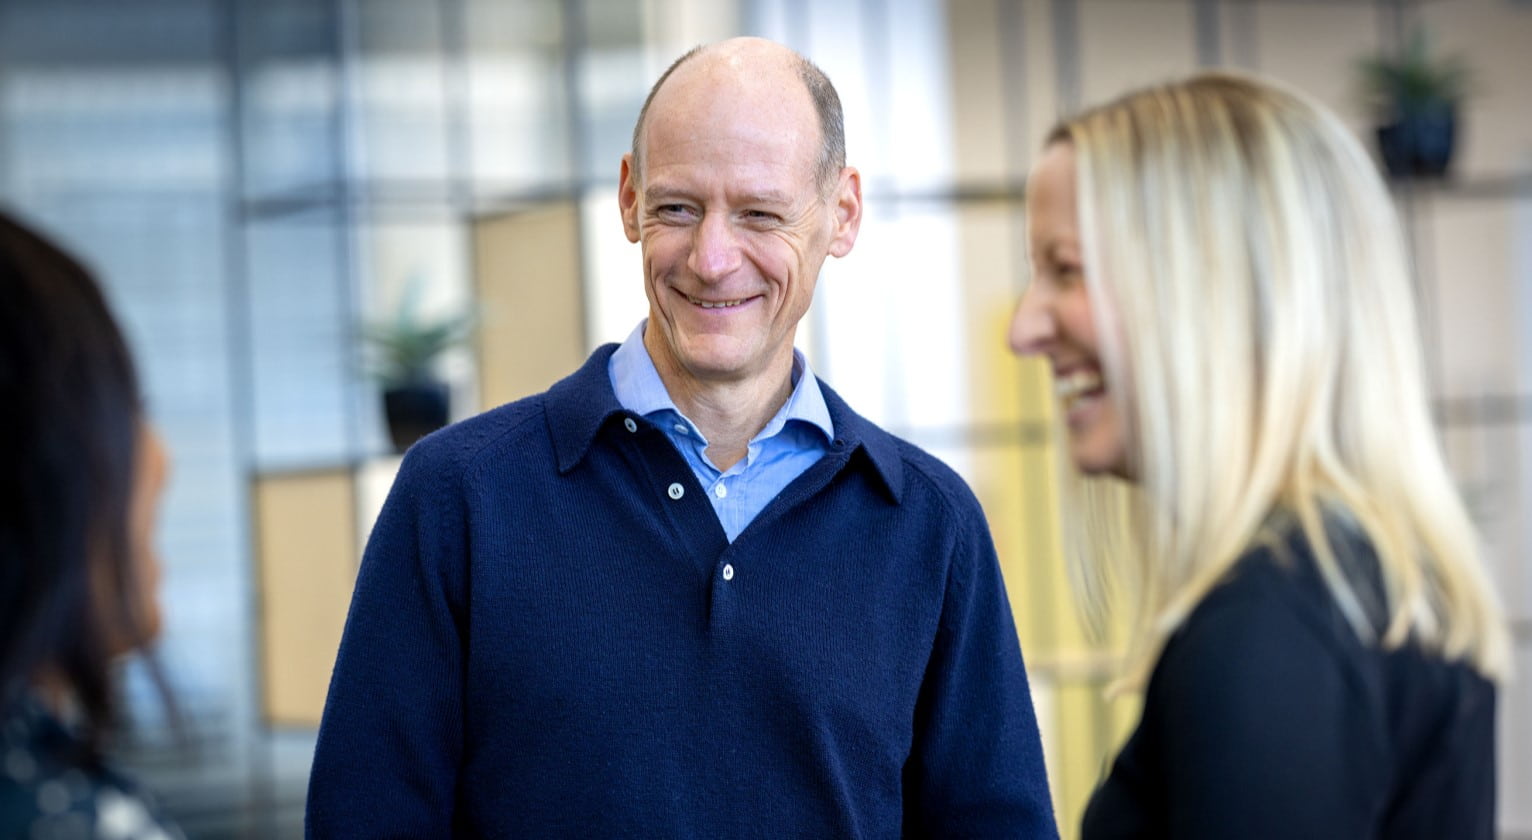
"In the first half of 2026, we delivered sustained strength in financial performance, with continued income growth, improving operating leverage, strong credit performance, growing capital generation and increasing shareholder returns."
Charlie Nunn, Group Chief Executive
£9.7bn
Net income
(+9% YoY)
£4.9bn
Operating costs
(flat YoY)
£3.1bn
Statutory profit after tax
(+23% YoY)
2% / 1%
Loan / deposit growth YTD
(loans up £10.4bn, deposits up £4.4bn)
17.1%
Return on tangible equity
(+3pp YoY)
£1.9bn
Total capital return
(incl +30% dps growth and £1bn buyback)
Based on the sustained strength in our financial performance and our current macroeconomic assumptions, for 2026 the Group reiterates its guidance:
1. Excludes capital distributions.
2. Includes capital distributions announced in respect of the reporting period.
Based on our current macroeconomic assumptions, from 2027 to 2030 the Group expects:
We're a leading UK-based financial services group with over 325 years' history and a unique family of household brands. Our purpose at Lloyds Banking Group is Helping Britain Prosper.
Our annual report provides disclosures relating to our strategic, financial, operational, environmental and social performance – along with detail on our strategy.

We have an important role to play in creating a more sustainable and inclusive future for people and businesses, by shaping finance as a force for good.